E2E Networks: It owns the hotel. Netweb Technologies builds the rooms and hands over the keys
Pranav Yadav · · 9 min read
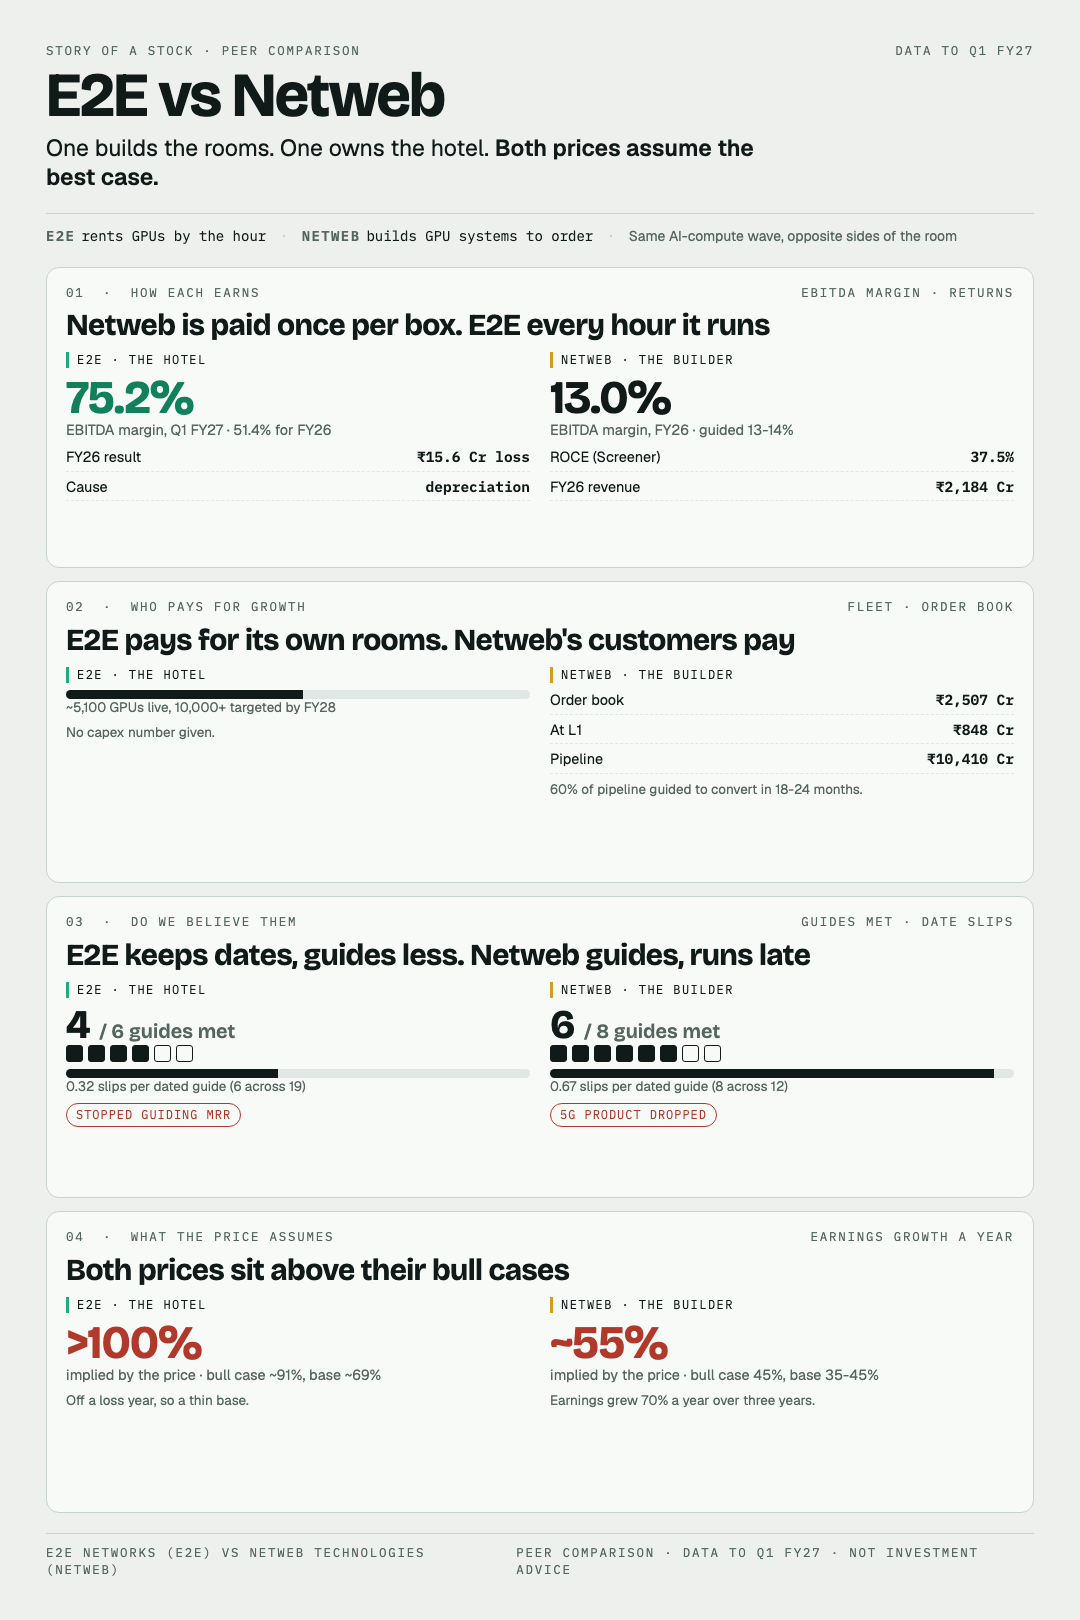
Both companies on one page. Below is the same thing in words, built from every transcript and deck each has published, plus the broker notes we hold on Netweb.
Our own leaderboard ranks E2E Networks 8th and Netweb Technologies 53rd.
About half of that gap is not in the businesses. It is in our model, and I'll show where in Section 4.
The other half is real, and it comes from one difference. India is building AI compute, and these two companies sit on opposite sides of the same room.
Netweb builds the room. It designs and assembles the GPU systems, hands over the keys, and moves on to the next order.
E2E owns the hotel. It keeps the GPUs and rents them out by the hour, and it earns only while a guest is checked in.
I have written about each on its own before: E2E as a hotel adding a wing as big as itself, Netweb as a contractor who keeps finishing early. This post puts the builder and the owner side by side.
The central takeaway
The question is not which of these two is the better company. They are in different businesses that happen to ride the same wave.
The question is which risk you would rather own. Netweb's risk is the next order. E2E's risk is the next guest.
On the record, Netweb keeps its growth guide and misses its dates. E2E keeps its dates, and now guides almost nothing.
Both prices already assume more than the best case either company's own guides support.
At a glance
- Size. Netweb did ₹2,184 Cr of revenue in FY26; E2E did ₹245.6 Cr. Netweb's market value is ₹27,729 Cr; E2E's is ₹12,333 Cr.
- Margin. Netweb guides EBITDA at 13-14% and printed 13.0% for FY26. E2E printed 51.4% for FY26 and 75.2% in Q1 FY27.
- Returns. Netweb's return on capital employed is 37.5% on Screener's figures. E2E closed FY26 at a ₹15.6 Cr loss, driven by depreciation.
- Latest quarter. Q1 FY27 revenue grew 172% at Netweb and 334% at E2E, year on year.
- Guidance record. Netweb has met 6 of 8 closed financial guides, with 8 slips across 12 dated commitments. E2E has met 4 of 6, with 6 slips across 19.
- Moat. Both narrow and rated weak. Neither has been through a downturn as a listed company.
- What the price assumes. Netweb about 55% earnings growth a year, against a bull case of 45%. E2E above 100%, against a bull case of about 91%.
Where this lives on the portal: the E2E Networks guidance page and the Netweb guidance page.
What you need to know first
A GPU earns money in two places. Once when it is built into a system and sold, and again every hour someone rents it after that.
Netweb takes the first payment. It designs and manufactures supercomputers, AI systems and private-cloud hardware around other firms' chips, on a project basis, for government, research institutes and large companies. AI systems went from about 10% of its revenue in the first half of FY24 to 62% in Q1 FY27.
E2E takes the second. It runs its own data centres in Delhi NCR and Chennai and rents GPU time to AI teams, mostly by the hour and mostly without long contracts.
So Netweb's revenue is lumpy and its margin is thin. E2E's revenue recurs and its margin is fat. That one fact explains most of what follows.
1. Netweb is paid once per box. E2E is paid every hour the box runs
Netweb's EBITDA margin has sat inside a 13-14% band for four years, and FY26 printed 13.0%. That is what building hardware to order pays. But the customer funds the box, so very little of Netweb's own capital is tied up in it. Its return on capital employed is 37.5% on Screener's latest figures.
E2E's margin is four to six times higher. It printed 51.4% for FY26 and 75.2% in Q1 FY27. But E2E owns every GPU it rents, and a GPU depreciates whether or not a guest is checked in. That is how a 51% EBITDA margin became a ₹15.6 Cr loss for the year.
One earns a thin margin on little capital. The other earns a fat margin on a lot of it. The evidence here is firm on both sides.
2. Netweb's growth is paid for by its customers. E2E pays for its own
Netweb carries an order book of ₹2,507 Cr, another ₹848 Cr at the final-negotiation stage, and a pipeline of ₹10,410 Cr that it guides 60% of to convert over 18-24 months. Every one of those systems is funded by the customer who ordered it. Netweb's next unit of growth costs it working capital and factory time.
E2E is building a new wing as big as the hotel. About 5,100 GPUs are live today, the target is 10,000-plus by FY28, and the second 1,024-GPU Blackwell cluster was still "expected soon" at the last call. E2E pays for every room before the first guest arrives, and it has declined to give a capex number.
Netweb has the orders and needs to keep winning them. E2E has the rooms and needs to fill them. The evidence is firm on disclosure. E2E's ceiling on spending is not public.
3. Netweb keeps its guide and misses its dates. E2E keeps its dates and stopped guiding
Netweb has guided a 30-40% revenue growth rate since its first call after listing, trimmed it once and raised it to 35-40%. It has beaten that every year, and it has met 6 of its 8 closed financial guides. Where it slips is the calendar: 8 slips across 12 dated commitments, and one product, a 5G O-RAN launch, that slipped three times and was then never mentioned again. Our read labels its credibility mixed.
E2E has met 4 of its 6 closed financial guides and slipped only 6 times across 19 dated commitments. Our read labels it credible. But the two guides it missed were the ones on profit, an exit EBITDA margin of 65-75% that printed 60.7% and a PAT margin of 15-20% that met a loss. It walked back a 40-50% growth frame, and at Q1 FY27 it said it no longer guides monthly revenue at all.
One company says a lot and is sometimes late. The other says less each quarter and is rarely late on what it says. Neither pattern is a clean record.
4. Half of our #8 versus #53 gap is our model filling a blank
Our composite score blends a quality read, a growth read and a valuation read. Netweb's valuation read is a real number: 18 out of 100.
E2E's valuation read is blank, because the last full year was a loss and the scoring lens needs positive earnings. When that leg is blank, the composite fills in a neutral 5 out of 10.
That fill-in accounts for 0.38 of the 0.81 points between the two composites. The rest, 0.41, comes from E2E scoring higher on quarterly calls and on growth.
The fill-in flatters E2E more than it looks, because its price sits further above its own bull case than Netweb's does.
5. What the price already assumes
Working backward from today's price, Netweb needs earnings growth of about 55% a year. Our base case from its own guides is 35-45%, and our bull case is 45%. Netweb's earnings have grown 70% a year over the last three years, so the price is asking for a slower version of its past, not a new one.
E2E's price cannot be reached by our model even at 100% growth a year. Our base case is about 69% and our bull case about 91%. That rests on a thin earnings base, since the last full year was a loss, but the price is still asking for more than the best case the guides support.
Both prices sit above their bull cases. E2E's sits further above.
What would make me wrong
On Netweb:
- The pipeline is large. ₹10,410 Cr at 60% conversion is several years of FY26 revenue, and the price needs a slower rate than the one Netweb has already delivered.
- The margin band has held for four years, and Q1 FY27 ran above it at 14.7%.
- Returns are real — 37.5% on capital, as an asset-light builder should earn.
On E2E:
- The margin may be the new level. If 75.2% holds on a doubled fleet, earnings grow far faster than revenue.
- Its hit rate is good. 4 of 6 guides met and few slips is a company that mostly does what it says.
- Recurring revenue compounds. A room rented for four years earns more than a box sold once, if the guests stay.
And on both: a young listed record is exactly what you would expect before a long run, not proof that one cannot happen.
The one question that matters
EBITDA margin, held for a full year, against each company's own band.
Both are running above their guide right now. Netweb printed 14.7% in Q1 FY27 against 13-14%. E2E printed 75.2% against its medium-term 65-75%.
If Netweb holds above 13% while the pipeline converts, the builder's thin margin is enough. If E2E holds near 75% on twice the rooms, the owner's depreciation stops mattering.
What I'll be watching
- Does E2E's second Blackwell cluster go live on time, and does it report one GPU count, on one basis?
- How much of Netweb's ₹10,410 Cr pipeline converts over the next two quarters?
- Does either margin fall back inside its band by the end of FY27?
Final assessment
Netweb earns less per box and risks very little capital. E2E earns more per hour and carries every GPU on its own books. Both prices already assume the best case.
The full reads are on the E2E Networks page and the Netweb Technologies page.
The builder needs the next order. The hotel needs the next guest. The price has already checked both of them in.
This is a summary of what E2E Networks' and Netweb Technologies' filings, earnings calls and broker notes say. It is not investment advice or research.