Pine Labs: Its toll booths are busy. Most of the traffic rides free
Pranav Yadav · · 9 min read
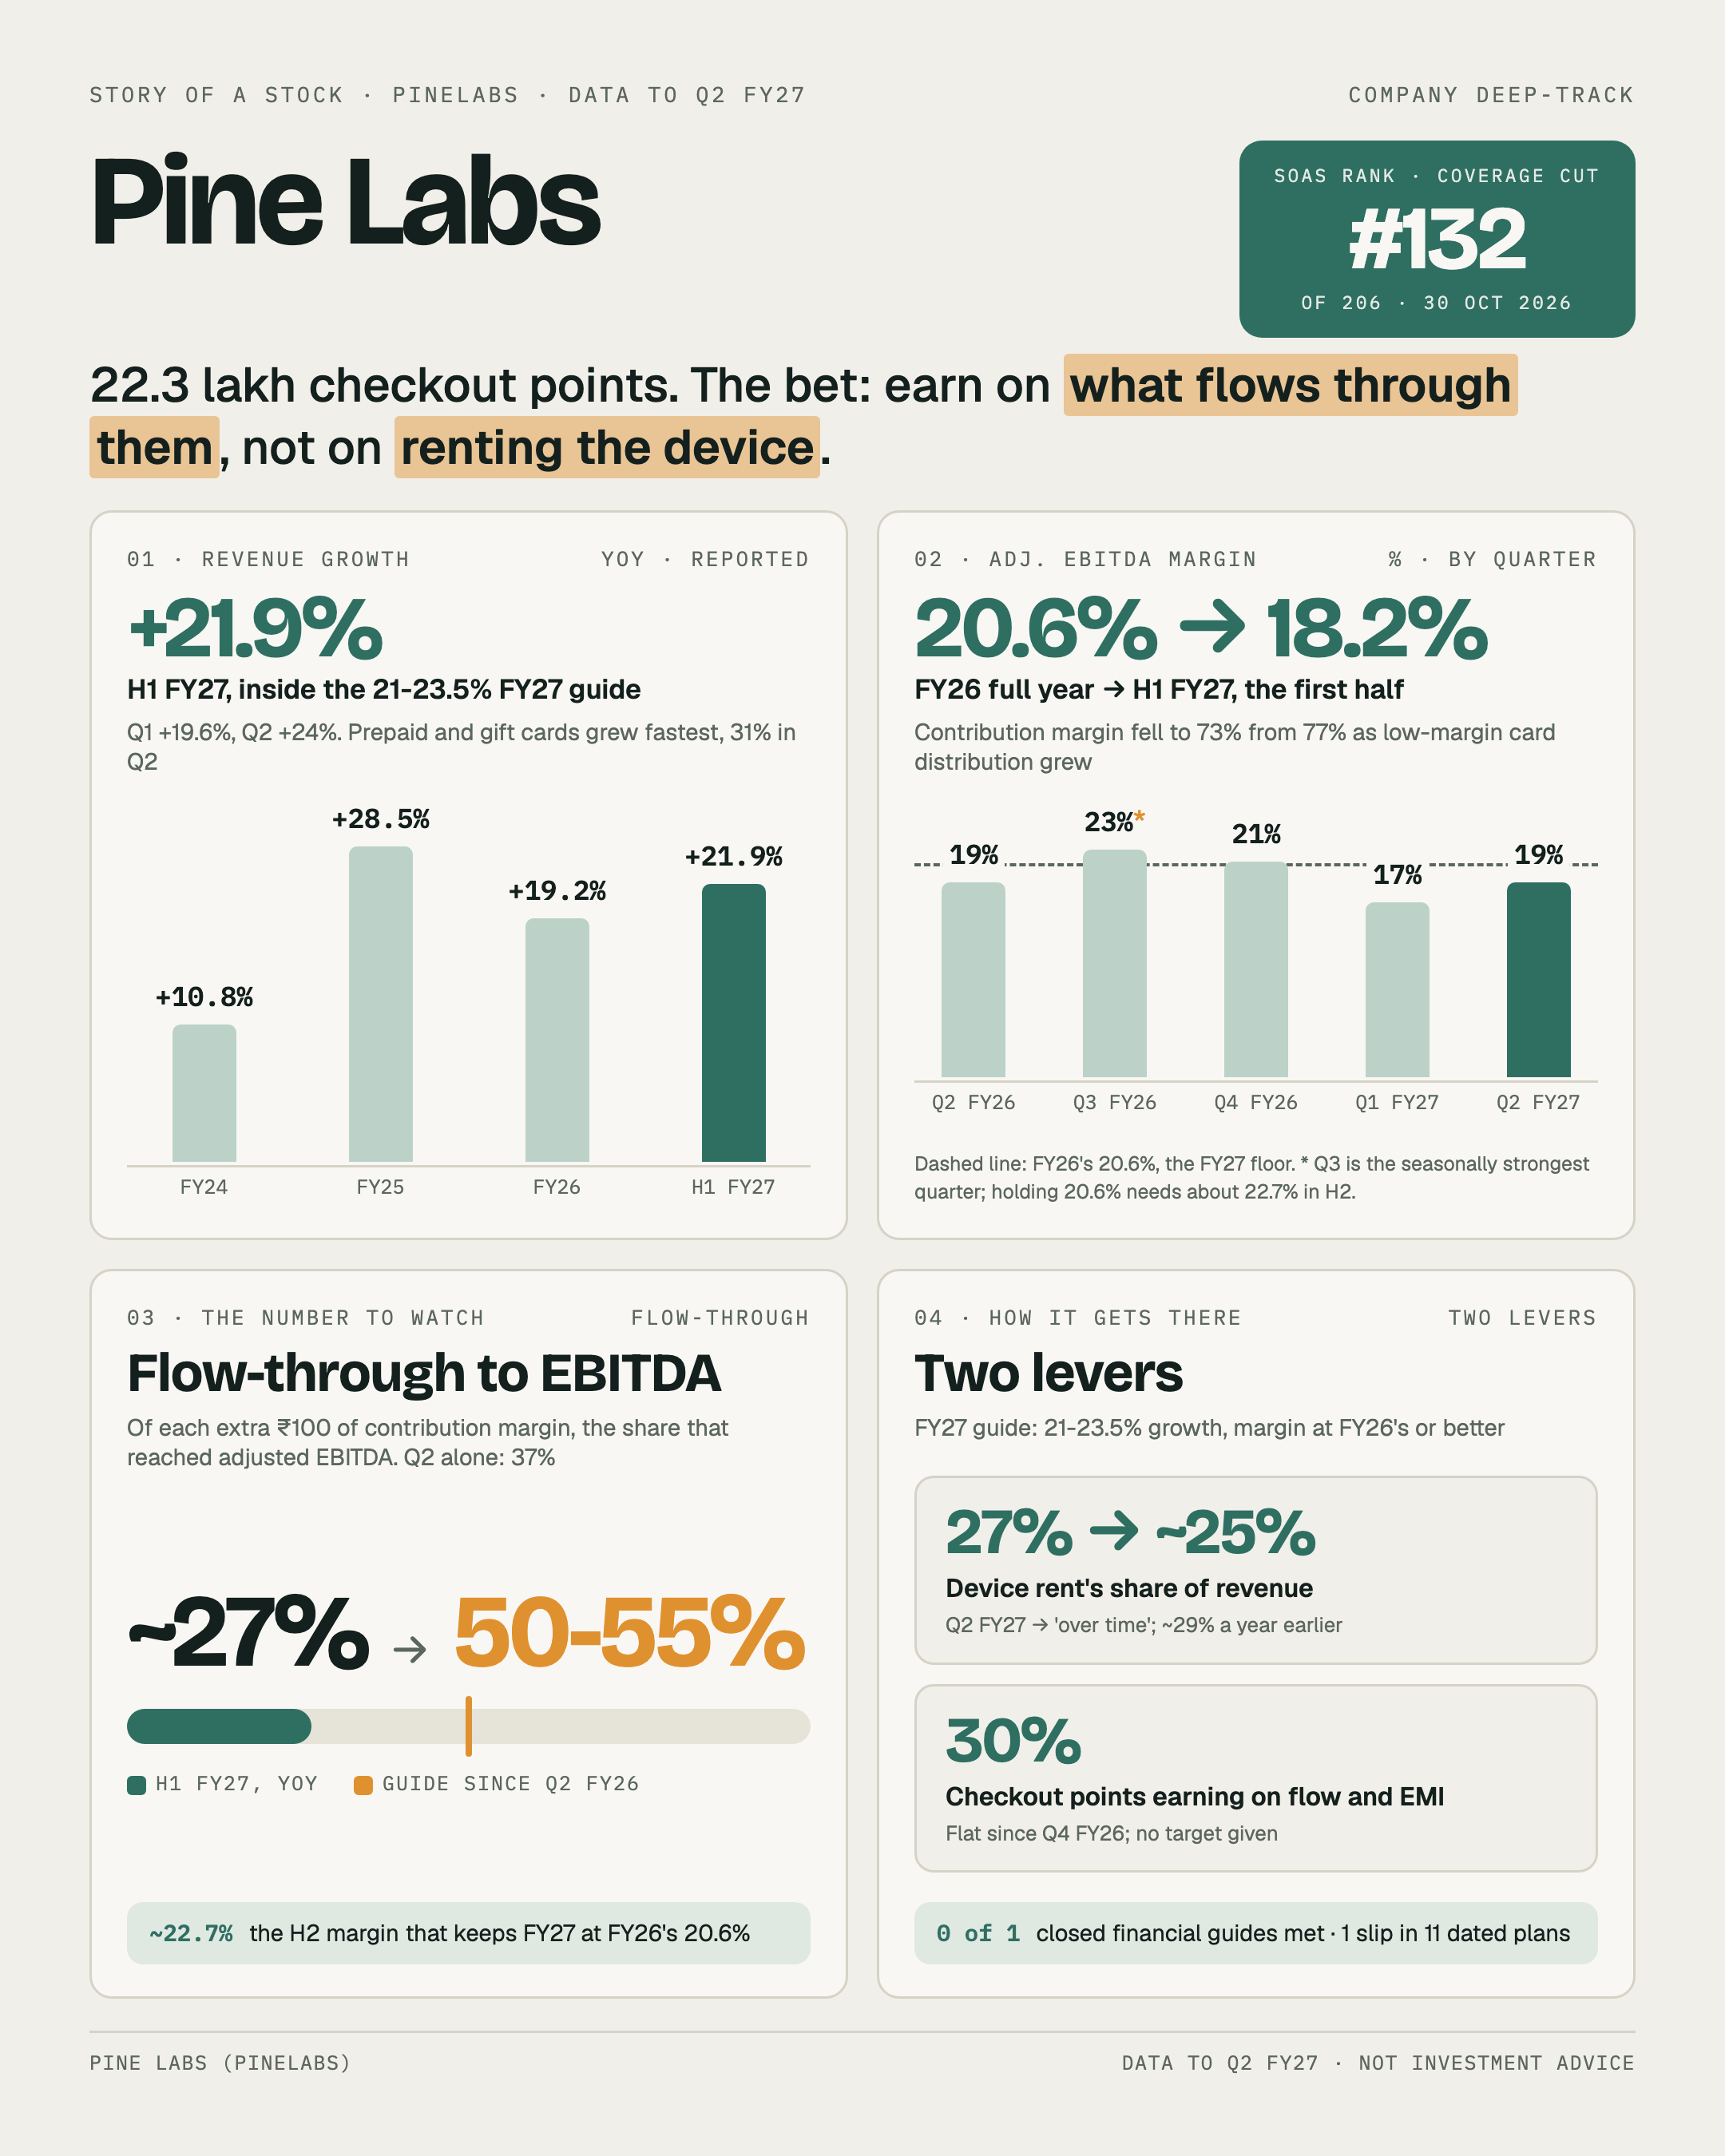
That's the Pine Labs story on one page. Below is the same story in words, built from four earnings calls, seven investor decks, the Q2 FY27 results filing, the FY26 annual report and eleven broker notes. The official Q2 FY27 transcript is not out yet, so the Q2 read comes from the deck, results and press release.
Picture a toll booth on a shop counter, then 22.3 lakh of them across India. The shop pays rent for its booth, and every payment that crosses the counter passes through it.
The catch is that the booths do not own the road. The rules set the toll on its busiest lane, UPI, at zero, and UPI is more than 70% of the transactions through Pine Labs' checkout points. On the card lane, by a broker's count, most of the toll goes to the bank that issued the card.
Rent is the old way to earn, and it is shrinking: device subscription was 27% of revenue in Q2 FY27, against about 29% a year earlier. The plan is to make the traffic pay. The revenue has started to follow; what it costs to collect is the open question.
Where this lives on the portal: the Pine Labs company page.
1. What Pine Labs does
One booth, several ways to earn
Pine Labs runs the terminals, QR devices, gateways and software that let shops and websites take cards, UPI and wallets. In FY26 payments infrastructure, which holds the rent, was 32% of revenue; flow, affordability and processing, which earns on what crosses the counter, 33%; prepaid and gift-card issuing 32%; fintech infrastructure for banks 3%.
EMI is the toll that pays
The best-paying traffic is a purchase turned into EMI at the counter. Pine Labs links 450+ brands and 40+ lenders, and on a terminal EMI sale the merchant, the brand and the consumer each pay it a fee. By management's count, affordability is about a third of the flow segment's volume but two-thirds of its revenue.
Gift cards: faster growth, thinner margin
The issuing platform, built around Qwikcilver, runs gift-card and prepaid programmes for brands and employers. It grew 30.3% in FY26, against 14.6% for the checkout side, helped by a January 2025 clarification that gift cards carry no GST. It earns less: about 55% contribution margin in Q2 FY27, against about 82% for the checkout side.
2. How it got here
Years of losses on machines it carried
Revenue rose from ₹932 Cr in FY22 to ₹2,711 Cr in FY26, and the company lost money every year until FY26, ₹342 Cr at the worst in FY24. The losses peaked when depreciation did, much of it on terminals carried on its own books. It now sells many terminals upfront, and plant and equipment fell from ₹706 Cr in FY23 to ₹339 Cr in FY26.
A listing, and two deals
In June 2025 its Singapore parent was amalgamated into the Indian company, leaving no identifiable promoter. It listed on 14 November 2025, raising ₹2,080 Cr, ₹532 Cr of which repaid debt. The gift-card business came by acquisition, and ₹459 Cr of Qwikcilver goodwill still sits in its equity. The latest deal is small: Shopflo, a checkout tool for online brands, bought outright for ₹88 Cr and consolidated from 26 May 2026. The FY27 guide carries no acquired growth.
3. How the numbers have moved
The first profit leaned on other income
FY26 brought the first annual profit in this record, ₹113 Cr. Pre-tax profit was ₹137 Cr and other income ₹133 Cr, over a third of it old liabilities written back and most of the rest interest on deposits, unspent IPO money among them.
Two margins, and why I use one
The company's adjusted EBITDA leaves out the non-cash ESOP charge: ₹559 Cr in FY26, up 57%, a 20.6% margin. Screener's operating margin, which counts the ₹152 Cr ESOP charge, was 13%. I quote the adjusted figure because the guide is written on it.
Cash turned before profit did
Operating cash flow was negative from FY22 to FY24, then ₹50 Cr in FY25 and ₹395 Cr in FY26. Much of the cash on the balance sheet is customers' money, held for prepaid-card holders and merchant settlements.
Thin returns, a moat in one place
Return on net worth was 1.9% in FY26, against the 16.8% pre-tax cost of capital the company uses to test its goodwill. Our moat call is narrow and weak. The one source we credit is the EMI network, slow to rebuild, with take rates that held as volumes grew. Payments carry none: card EMI converted in a bank's own app earns Pine Labs nothing, and Stripe and Adyen are moving in-store.
The checks are mostly clean: an unmodified audit, related-party dealings of 3.13% of revenue, nearly all of it managers' pay, and contingent liabilities of 5.99% of net worth, the largest a GST demand on gift-card costs that a court has stayed.
4. The last two quarters
Growth came back to the guide
Q1 FY27 revenue was ₹736.92 Cr, up 19.6%. Q2 was ₹806 Cr, up 24%, with prepaid and gift cards up 31%. The half came to ₹1,543.11 Cr, up 21.9%, inside the 21-23.5% FY27 guide.
More traffic, the same share paying
The booths reached 22.3 lakh, up 17% in a year. Value through them grew faster, with flow, affordability and processing GTV up 52% and UPI GTV up 77%+. But the share of checkout points earning on flow and EMI has sat at 30% since Q4 FY26.
Profit nearly doubled, the margin stayed short
Adjusted EBITDA was ₹126 Cr in Q1, a 17% margin, and ₹155 Cr in Q2, 19%, so the half earned 18.2% against FY26's 20.6%. Contribution margin, what is left after direct costs, fell to 73% from 77% a year earlier as the distribution cost of prepaid cards rose 54%. Other indirect costs, which the deck puts down to brand building and top-merchant spending, rose 65% to ₹76 Cr.
Lower down, profit moved fast. Pre-tax profit went from ₹38 Cr in Q1 to ₹61 Cr in Q2, and net profit from ₹20 Cr to ₹39 Cr, as ESOP and finance costs fell. Tax took 41.3% of H1's pre-tax profit, because overseas losses cannot be set against Indian profit.
5. Where growth comes from next
Our cases, and what they cost
Our base case is the guide, 21-23.5% revenue growth a year over two years, with a bull case of 23.5-26% and a bear case of 17-21%, margins held flat because Pine Labs gives no number beyond its floor. Management says it has no interest in raising money, with net cash of ₹2,345 Cr at 30 September. Growth costs operating spend instead, about 500 more salespeople in a year and a bigger brand budget.
Booths paid on traffic
Fuel is the cleanest example of the bet. In Q4 FY26 Pine Labs won contracts from BPCL, HPCL and IOCL, had about 1 lakh terminals in by Q1 FY27 and expects about 130,000 by the end of FY27, paid mostly on flow rather than device rent.
UPI is where the traffic grows fastest: the deck looks for monthly UPI GTV of ₹33-34k Cr in FY28, from about ₹20k Cr now. That lane pays nothing yet. NPCI's 0.4% cap on merchant charges for UPI payments above ₹2,000 would change it; the deck calls it proposed, the same day's press release notified.
The number that decides it
The margin turns on flow-through: of every extra ₹100 of contribution margin, management guides ₹50-55 to reach adjusted EBITDA. In H1 about ₹27 did, ₹37 in Q2 alone. Over time it wants device rent near 25% of revenue, from 27% now.
6. What management promised, and what it delivered
There is little record to grade, and our verdict says so: not assessable. Only one guide on revenue or margin has closed. Q1 FY27 revenue was guided at the lower end of the 21-23.5% band, the CEO adding "is it going to be 20 or is it going to be 21?", and came in at 19.6%, 1.4 points short of 21%. One miss is too few to score.
Dates have held better, with one slip across 11 dated plans: an employee benefits card promised within 45-60 days of the May call became "by October" and launched by October, two to three months after the first date.
The live guides lean on the second half. The margin floor needs about 22.7% in H2, and Q3 FY26 printed 23%. Two guides have moved: contribution margin was cut from 76-78% to 73-74% for FY27, with H1 at 72.6%, and the full-year tax guide of 28-30% is now "~30% by the exit of FY27", after 41.3% in H1.
7. What the price already assumes
On 18 September, at ₹192 a share, the reverse-DCF in our valuation check had the price implying about 69% a year of near-term earnings growth. Our cases run 17-21% in the bear case, 21-23.5% in the base case and 23.5-26% in the bull case, so it sat at about three times the base case.
That figure is six weeks old. Our valuation check does not rate Pine Labs today: it listed on 14 November 2025, and under a year of trading is too short a history of its own P/E to read the price against. The 18 September figure was also solved before Q2 FY27's results, on that day's price and trailing profit.
Our cases hold margins flat, so profit growth that far above revenue growth needs margins to widen a long way: what the flow-through guide promises, and where H1 came up short.
What would make me wrong
- The leverage may be arriving lower down. Pay before ESOP rose 2% while revenue rose 24%, and pre-tax profit took 56% of Q2's extra contribution margin, above its 45-55% guide.
- Q3 is the strong quarter. Management calls it seasonally the strongest, and Q3 FY26 printed 23%.
- The free lane may start paying. If the UPI cap applies, large tickets on the busiest lane earn something.
- The moat call may be harsh. Management claims 80-85% of EMI at the counter, from a report it has not shared.
The opposite error would be to read Q2's 24% as the story: the margin, the stalled 30% and a falling contribution margin are where the bet is unproven.
The full read is on the Pine Labs company page.
A toll booth pays its owner only when the traffic pays. Pine Labs has more traffic every quarter, and the second half will show whether getting it to pay costs less than it brings in.
This is a summary of what Pine Labs' filings, results documents, earnings calls, annual report and broker notes say. It is not investment advice or research.